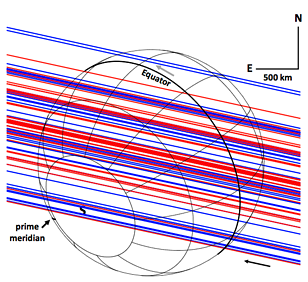
Geometry of the 5 October 2017 occultation by Triton. The 90 red and blue lines are "occultation chords", trajectories of the background star relative to Triton, as observed by 90 telescopes across Europe and north East USA. The blue chords produced light curves that had sufficient signal-to-noise ratio to be included in a global atmospheric fit. Image from Figure 5 of the paper described in the text.
A recent paper by J. Marques Oliveira characterises the structure of the atmosphere of Neptune's largest moon Triton in greater detail than before.
In "Constraints on the structure and evolution of Triton’s atmosphere from the 5 October 2017 stellar occultation and previous observations" (Oliveira, Sicardy et al, Astronomy & Astrophysics, Vol. 659, Article A136, March 2022), the authors primarily discuss the occultation of a 12.7-magnitude star by Triton.
Stellar occultations by foreground planets and/or moons can reveal details about the atmosphere of the occulting body. Instead of disappearing suddenly behind Triton at ingress, the background star dimmed more slowly as the increasingly dense layers of Triton's atmosphere moved in front of it. The light curves at both ingress and egress effectively probed the atmospheric layers at those two points above Triton's surface.
As seen from the Earth, Triton passed in front of the star Gaia EDR3 2610107911326516992 (hereafter "G26") just before midnight on 5th October 2017. It cast a shadow that sped across Europe, NW Africa and eastern USA at ~20km/s. More than 100 observatories in the shadow's path attempted to observe the occultation. Ninety light curves were produced, of which three (one from the LT's RISE fast-readout camera) had the best signal-to-noise ratio and were used for determining a detailed model of the atmosphere's density, pressure and temperature. They found a slight negative temperature gradient below ~30km altitude, implying a mesosphere just above an expected stratosphere, with a positive temperature gradient connecting the atmosphere to the cold surface.
Adding the next best 49 light curves enabled the creation of a synthetic and smoothed model of the density, pressure and temperature profiles, from an altitude of 47km down to the surface.

Occultation lightcurve taken with the LT's RISE fast-readout camera. Image from Figure 6 of the paper.
There have now been five occultation measurements of Triton's atmosphere, the first being in 1989 obtained by observing Voyager 2's radio signals as it passed behind the moon. A survey of all five measurements show that a transient pressure increase reported from a single chord transit in 1989 (and absent in the authors' 2017 data) was probably real, but remains debatable. This is due to the scarcity of high SNR light curves, and the lack of a fully consistent analysis of the best data sets used by other teams. The authors also explored a volatile transport model (VTM) by another author and found it supported only a modest increase of surface pressure over the same time period.
This VTM also concludes that for the pressure increase to be both weak and then absent by 2017, there must be N2 present between the equator and latitude 30°S, and a north polar cap extending as far south as 45°N.
Near the centre line of the shadow path, 42 observatories in northern Italy, the south of France, and central Spain observed a flash at mid-occultation as light from G26 refracted around Triton's atmosphere. Twenty-three of the light curves had a high enough signal-to-noise ratio to enable measurements that showed the atmosphere is spherical, with only a slight possibility of gravity waves. This implies that it's unlikely there are any supersonic winds in Triton's atmosphere.
Further work based on the occultation data will investigate these gravity waves, as well as the possible presence of haze layers and of a troposphere just above Triton's surface.